Most people's portfolio lives across three broker apps and a screenshot. This puts it on one page, in rupees, that you own.
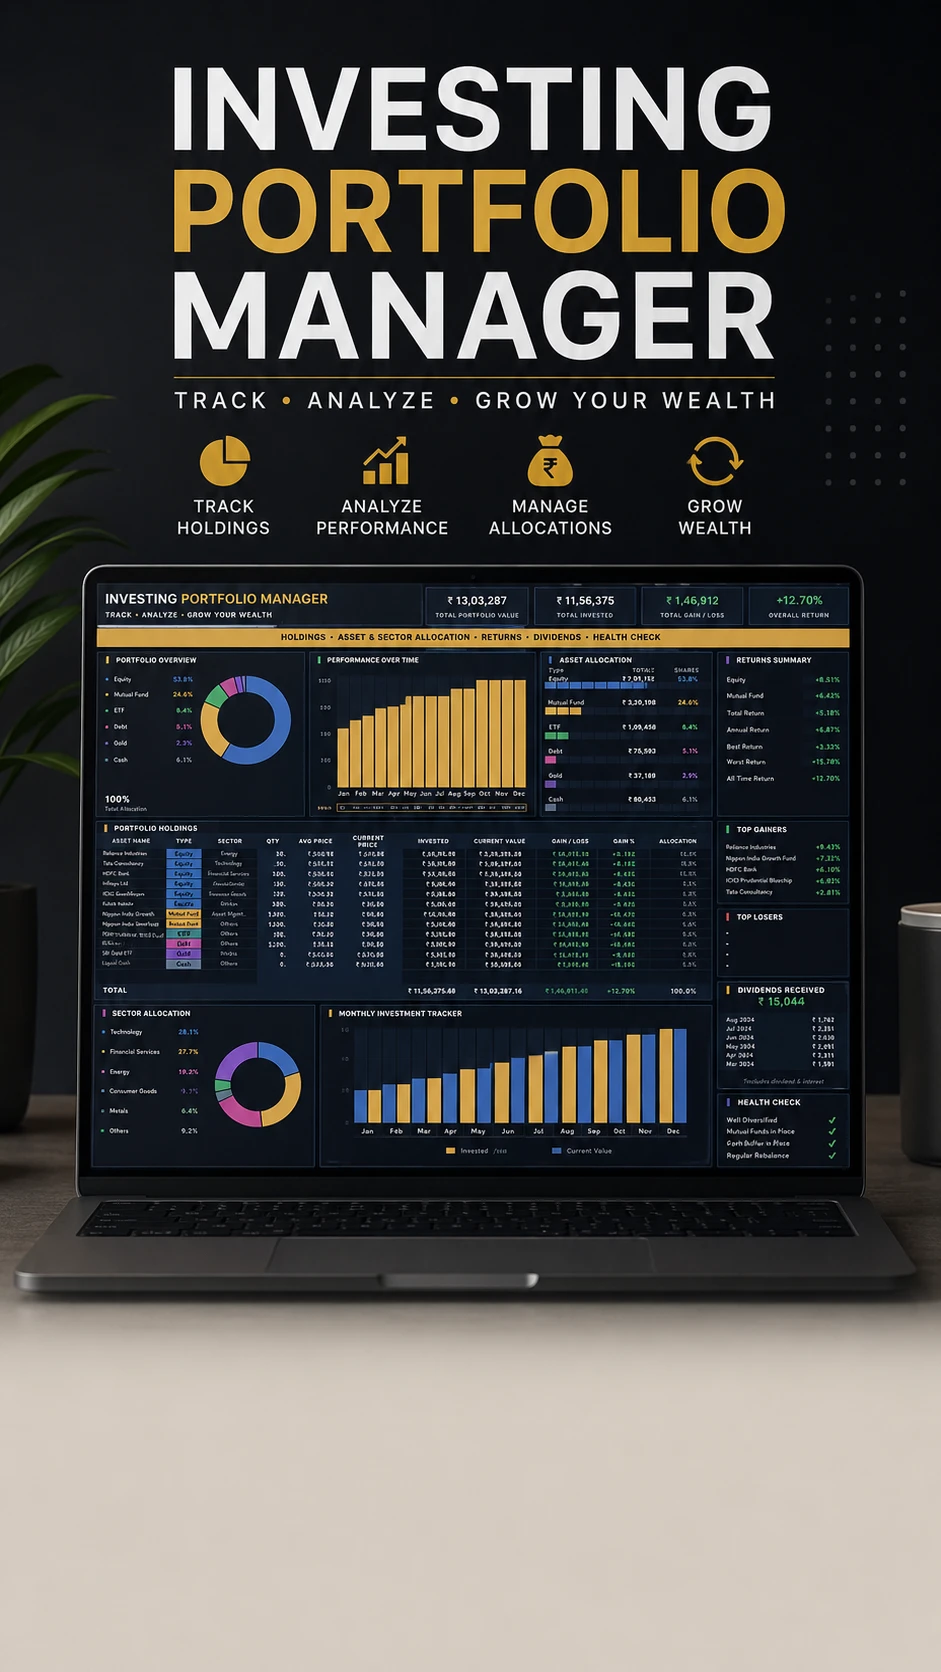
For each holding you type four things: quantity, average price, current price, and which type and sector it belongs to. From that the sheet derives invested amount, current value, gain or loss, gain percentage and what share of your portfolio it represents.
The dashboard covers total portfolio value, total invested, total gain or loss and overall return. Asset allocation splits across Equity, Mutual Fund, ETF, Debt, Gold and Cash. Sector allocation covers Technology, Financial Services, Energy, Consumer Goods, Metals and Others. A returns summary reads across 1 day, 7 days, 1 month, 3 months, 6 months, 1 year and all time.
Top gainers and top losers surface automatically, so the five things working and the five things not are always visible without sorting anything.
A monthly investment tracker charts invested against current value across the year, and a dividends panel keeps a running total of payouts.
The health check is the part most trackers skip: five diversification tests worth twenty points each — well diversified, healthy equity share, cash buffer in place, portfolio in profit, more than five holdings — scored out of 100. It is a prompt to look honestly at concentration, not a recommendation about what to buy.
This is a record-keeping tool for money you have already decided to invest. It does not recommend investments, forecast returns, or fetch live prices.